This week our In Focus section reviews the Florida Statewide Medicaid Managed Care Program (SMMC) Invitation to Negotiate (ITN), released on April 11, 2023, by the Florida Agency for Health Care Administration (AHCA). SMMC consists of three programs: Managed Medical Assistance (MMA), Long-term Care (LTC), and dental, covering 4.4 million individuals. This ITN is for contracts to provide MMA and LTC.
Under the SMMC program, all enrollees receive their services from a single plan providing managed medical assistance, long-term care, and specialty benefits. (Dental benefits are provided separately.)
AHCA will select plans that will achieve the agency’s goals, including providing healthy birth outcomes for mothers and their infants, improving childhood and adolescent mental health, maximizing home and community-based placement and services, and supporting the HOPE Florida program. HOPE Florida utilizes ‘Hope Navigators’ to help individuals achieve economic self-sufficiency, develop long term-goals, and map out a strategic plan by focusing on community collaboration between the private sector, faith-based community, nonprofits and government entities.
Additionally, with the new contracts, AHCA will implement the following changes:
Specialty plans will no longer be awarded separately but must be awarded to a comprehensive or MMA plan.
Enrolling voluntary recipients (such as individuals with intellectual or developmental disabilities) into the SMMC program and providing the opportunity for them to opt out
AHCA may mandatorily enroll into the MMA program full benefit dual-eligibles who are also in a Medicare Dual Eligible Special Needs Plan (DSNP).
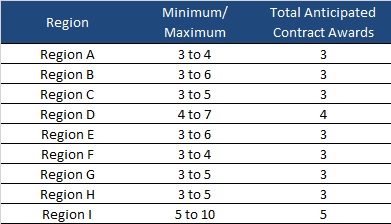
AHCA will invite 10 plans to negotiate for awards as shown below:
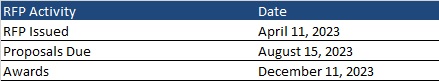
Timeline
Proposals are due August 15, 2023, with an anticipated award date of December 11. Contract will run from October 1, 2024, through December 31, 2030. Contracts may not be renewed, but AHCA may extend the term to cover any delays during the transition to a new plan.
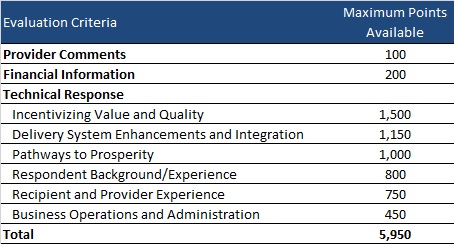
Evaluation
Plans can receive a total maximum number of points of 5,950. AHCA will invite top-ranking plans to negotiations to ensure that AHCA can enter into contracts with the minimum required number of plans per region.
Current Market
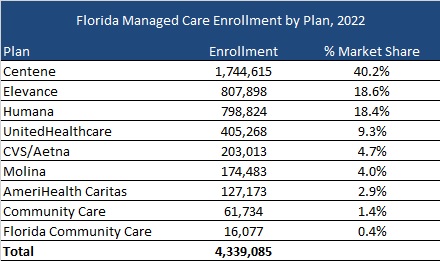
As of December 2022, Florida served 4.3 million MMA and LTC enrollees, excluding an additional 97,000 Children’s Medical Services enrollees in the Children’s Medical Services Network plan. Centene had the highest market share based on enrollment, at over 40 percent.
Policy crossroads and the end of the public health emergency due to COVID-19
This is part of a three-part series on significant implications of the end of the Public Health Emergency (PHE).
What does your organization need to know?
March 31st marked the end of the COVID-19 Medicaid continuous coverage condition. Most forecasts project between 10-15 million enrollees will lose Medicaid coverage. State Medicaid programs will lose supplemental funding provided for the continuous coverage requirement and begin to transition to normal eligibility operations. Health Management Associates (HMA) and HMA companies can help the full spectrum of stakeholders plan for, adjust to, and administer the changes up to and beyond the 12-month continuous coverage “unwinding” period. The immediate work can serve as a springboard for future improvement initiatives and to respond to federal guidance that is under development to strengthen and streamline eligibility and enrollment processes and improve the experience for consumers.
Who is affected by this change?
Payers including Medicaid managed care organizations and Qualified Health Plans
Provider organizations
Trade associations of Medicaid managed care or provider organizations
State and local community-based organizations
State and local governments responsible for administering and overseeing the eligibility processes for Medicaid and other public programs
Advocacy groups
Foundations
Vendors supporting state agencies, health plans and providers
Watch a video presentation about the HMA Coverage Model
What is in the HMA model?
HMA has developed an insurance mix model that projects how the resumption of Medicaid eligibility redeterminations beginning in April 2023 will affect Medicaid enrollment, employer sponsored insurance (ESI), Marketplace coverage, and the uninsured. The model includes enrollment projections for all 50 states and considers the enhanced Marketplace subsidies included in the Inflation Reduction Act (IRA). Approximately 20 million individuals gained coverage during the redetermination freeze and well over 10 million of the approximately 90 million current Medicaid enrollees are at risk for disenrollment. HMA’s model contemplates the variety in state approaches to managing the resumption of eligibility redeterminations as well as key insights related to the differential impact by Medicaid eligibility categories.
HMA can help with immediate needs to help you plan:
HMA has detailed state-specific unwinding policy insights for each state including observations regarding which states are taking more aggressive and less aggressive approaches.
We can provide technical assistance and strategic planning services to help states and organizations manage the necessary changes.
Actuarial experts can assist with acuity changes caused by the change in enrollment.
Our colleagues are available for a discussion of the product and the key policies influencing the projections.
On January 26, the Centers for Medicare & Medicaid Services (CMS) approved California’s (CA) section 1115 request to cover targeted healthcare services for incarcerated individuals 90 days before release. This historical partial rollback of the Medicaid Inmate Exclusion Policy empowers the CA Department of Health Care Services (DHCS) to collaborate with state agencies, counties, health plans and community-based organizations to create coordinated community reentry services focused on persons transitioning from incarceration to community that provide physical and behavioral healthcare services.
Fourteen states have pending section 1115 demonstration requests to provide specific healthcare services for justice-involved individuals. CMS has indicated it will be issuing guidance on the coverage parameters for healthcare services for individuals transitioning from carceral settings. These efforts allow states, counties, and cities to build coordinated systems of healthcare care to support reentry. Building such systems requires infrastructure development and enhancement, stakeholder engagement, strategic planning, and project and change management across justice partners, health plans, and community-based organizations.
Implementing the services will involve an in-depth understanding of the fundamental healthcare needs of justice-involved individuals, carceral setting healthcare delivery and reentry (transition to the community), and how to operationalize necessary changes to meet program requirements. Additionally, change management, critical stakeholder coordination, infrastructure, and technology development, enhancement, guidance on data-sharing agreements, and health plan involvement will need to be created or adapted to meet the CMS 1115 requirements. Administrators of carceral settings and correctional healthcare providers must coordinate services with community-based organizations and health plans to implement timely, cost-effective, and quality healthcare services to individuals leaving carceral facilities.
States, payors, correctional administrators, and healthcare providers will benefit from understanding the 1115 requirements to stand up this initiative, recommendations to facilitate the 1115 application process, how it intersects with healthcare delivery within a carceral setting and during reentry, and practical strategies for planning and operationalizing the effective delivery and coordination of healthcare services that meet program requirements.
On Thursday, April 6, 2023, HMA held a webinar to help states and other stakeholders understand the section 1115 parameters and provide insight to states, local government, correctional health settings, and providers on how to best plan for implementing such services.
Key experts covered the following topics:
Deep Dive into California’s section 1115 approval and lessons learned from the California application process?
Operationalizing In Reach and Re-entry Programming for Justice-Involved Individuals
Understanding the complex needs of justice-involved individuals.
What investments must states make to implement Medicaid-eligible services for justice-involved individuals?
What role can technology and digital health play in supplementing direct care?
The Role of Payers in new Services for Justice-Involved Individuals
HMA consultants bring unparalleled expertise in Medicaid policy, correctional health and a deep understanding of the unique needs of this population. We have the operational knowledge and experience with technology and digital health solutions, as well as the needed data and analytic capacity to collect the correct data to drive improvements in equity and access to care.
This week, our In Focus section reviews recent Medicaid enrollment trends in capitated, risk-based managed care in 32 states.[1] Many state Medicaid agencies post monthly enrollment figures by health plan for their Medicaid managed care population to their websites. This data allows for the timeliest analysis of enrollment trends across states and managed care organizations. All 32 states highlighted in this review have released monthly Medicaid managed care enrollment data into the fourth quarter (Q4) of 2022. This report reflects the most recent data posted. HMA will continue tracking enrollment throughout the eligibility redetermination period. HMA has made the following observations related to the enrollment data shown on Table 1 (below):
The 32 states in this report account for an estimated 71 million Medicaid managed care enrollees as of December 2022. Based on HMA estimates of MCO enrollment in states not covered in this report, we believe that nationwide Medicaid MCO enrollment was likely about 75 million in December 2022. As such, the enrollment data across these 32 states represents approximately 95 percent of all Medicaid MCO enrollment.
Across the 32 states tracked in this report, Medicaid managed care enrollment is up 7.5 percent year-over-year as of December 2022.
All states, besides Mississippi, saw increases in enrollment in December 2022, compared to the previous year, due to the gains from the COVID-19 pandemic. Mississippi Medicaid managed care enrollment fell because the state shifted members to FFS during the public health emergency.
Twenty-three of the 32 states – Arizona, California, District of Columbia, Illinois, Indiana, Iowa, Kentucky, Louisiana, Maryland, Michigan, Minnesota, Missouri, Nebraska, Nevada, New Jersey, New Mexico, New York, Ohio, Oregon, Pennsylvania, Virginia, Washington, and West Virginia – expanded Medicaid under the Affordable Care Act and have seen increased Medicaid managed care enrollment since expansion.
The 23 expansion states listed above have seen net Medicaid managed care enrollment increase by 3.5 million members, or 7.2 percent, in the past year, to 52.2 million members at the end of 2022.
The nine states that have not yet expanded Medicaid as of December 2022 – Florida, Georgia, Kansas, Mississippi, North Carolina, South Carolina, Tennessee, Texas, and Wisconsin – have seen Medicaid managed care enrollment increase 8.3 percent to 19 million members at the end of 2022.
Table 1 – Monthly MCO Enrollment by State – July 2022 through December 2022
Jul-22
Aug-22
Sep-22
Oct-22
Nov-22
Dec-22
Arizona
2,069,048
2,079,360
2,095,101
2,106,800
2,116,444
2,127,666
+/- m/m
8,527
10,312
15,741
11,699
9,644
11,222
% y/y
7.6%
0.0%
7.5%
7.4%
7.2%
7.1%
California
12,929,500
13,013,324
13,073,427
13,132,616
13,231,993
13,204,398
+/- m/m
215,506
83,824
60,103
59,189
99,377
(27,595)
% y/y
9.8%
9.9%
9.9%
9.9%
10.2%
9.5%
D.C.
246,957
247,704
248,577
249,617
250,676
+/- m/m
3,223
747
873
1,040
1,059
N/A
% y/y
6.7%
6.7%
6.5%
6.5%
6.4%
Florida
4,385,965
4,432,233
4,465,670
4,502,297
4,537,121
4,581,266
+/- m/m
41,441
46,268
33,437
36,627
34,824
44,145
% y/y
10.9%
10.9%
10.7%
10.7%
10.7%
11.0%
Georgia
1,975,277
1,988,727
2,016,462
2,027,275
2,035,673
+/- m/m
13,117
13,450
N/A
N/A
10,813
8,398
% y/y
9.8%
9.5%
9.0%
8.7%
8.3%
Illinois
2,890,332
2,884,029
2,900,232
2,929,584
2,965,007
3,000,717
+/- m/m
(8,672)
(6,303)
16,203
29,352
35,423
35,710
% y/y
5.1%
4.5%
4.1%
4.4%
5.1%
5.5%
Indiana
1,742,762
1,761,692
1,769,400
1,781,464
1,797,451
1,813,044
+/- m/m
6,906
18,930
7,708
12,064
15,987
15,593
% y/y
11.6%
11.3%
11.0%
10.5%
10.2%
10.3%
Iowa
795,534
799,748
807,296
812,481
814,490
+/- m/m
2,642
4,214
7,548
N/A
N/A
2,009
% y/y
5.9%
5.8%
6.4%
6.0%
6.1%
Kansas
489,309
490,911
492,640
497,257
499,143
500,814
+/- m/m
2,691
1,602
1,729
4,617
1,886
1,671
% y/y
N/A
N/A
N/A
N/A
8.3%
6.3%
Kentucky
1,494,068
1,487,387
1,509,274
1,518,906
1,528,484
1,534,657
+/- m/m
6,069
(6,681)
21,887
9,632
9,578
6,173
% y/y
5.5%
5.3%
5.6%
5.8%
6.7%
6.1%
Louisiana
1,821,644
1,828,015
1,833,457
1,841,693
1,858,092
1,860,170
+/- m/m
7,213
6,371
5,442
8,236
16,399
2,078
% y/y
4.6%
4.5%
4.4%
4.7%
5.2%
5.8%
Maryland
1,496,677
1,502,271
1,508,469
1,514,381
1,521,171
1,529,308
+/- m/m
8,205
5,594
6,198
5,912
6,790
8,137
% y/y
6.5%
6.2%
6.1%
5.8%
5.8%
5.7%
Michigan
2,280,243
2,294,432
2,299,913
2,309,913
2,319,951
2,324,046
+/- m/m
2,923
14,189
5,481
10,000
10,038
4,095
% y/y
3.8%
3.6%
3.5%
3.7%
4.5%
4.3%
Minnesota
1,261,112
1,262,073
1,278,954
1,286,890
1,293,858
1,299,194
+/- m/m
1,893
961
16,881
7,936
6,968
5,336
% y/y
7.3%
6.7%
7.4%
7.5%
7.5%
7.5%
Mississippi
367,137
363,387
364,612
355,694
367,902
396,880
+/- m/m
(452)
(3,750)
1,225
(8,918)
12,208
28,978
% y/y
-22.7%
-19.9%
-17.4%
-17.3%
-12.5%
-3.9%
Missouri
1,038,239
1,065,217
1,099,707
1,118,373
1,136,589
1,157,005
+/- m/m
26,520
26,978
34,490
18,666
18,216
20,416
% y/y
27.0%
29.1%
32.6%
31.7%
31.8%
29.0%
Nebraska
363,328
366,202
369,770
372,613
374,857
378,237
+/- m/m
2,740
2,874
3,568
2,843
2,244
3,380
% y/y
12.4%
11.9%
11.7%
11.2%
10.8%
10.6%
Nevada
687,362
689,139
697,752
675,465
685,736
692,890
+/- m/m
9,464
1,777
8,613
(22,287)
10,271
7,154
% y/y
9.3%
9.0%
9.3%
4.2%
5.2%
5.7%
New Jersey
2,100,947
2,113,930
2,125,181
2,130,868
2,144,514
2,158,966
+/- m/m
10,897
12,983
11,251
5,687
13,646
14,452
% y/y
7.4%
7.4%
7.2%
7.0%
7.1%
7.0%
New Mexico
809,991
811,732
812,995
813,630
814,466
815,798
+/- m/m
2,491
1,741
1,263
635
836
1,332
% y/y
4.2%
3.7%
3.4%
3.0%
2.6%
2.3%
New York
5,855,615
5,853,108
5,878,519
5,906,264
5,929,288
5,961,782
+/- m/m
39,970
(2,507)
25,411
27,745
23,024
32,494
% y/y
4.5%
4.3%
4.2%
4.3%
4.5%
4.6%
North Carolina
1,738,545
1,746,948
1,757,503
1,768,974
1,778,199
1,837,423
+/- m/m
9,047
8,403
10,555
11,471
9,225
59,224
% y/y
8.0%
6.8%
6.7%
6.6%
6.6%
9.5%
Ohio
2,964,731
2,963,616
2,960,922
2,958,666
2,961,983
2,973,763
+/- m/m
(1,340)
(1,115)
(2,694)
(2,256)
3,317
11,780
% y/y
3.4%
2.6%
1.9%
1.4%
1.0%
0.9%
Oregon
1,193,358
1,202,198
1,206,520
1,211,099
1,221,435
1,228,054
+/- m/m
3,920
8,840
4,322
4,579
10,336
6,619
% y/y
8.3%
8.4%
7.7%
7.6%
7.4%
7.2%
Pennsylvania
2,895,837
2,909,985
2,920,584
2,937,049
2,950,613
2,966,207
+/- m/m
13,973
14,148
10,599
16,465
13,564
15,594
% y/y
7.4%
7.3%
6.9%
6.8%
6.6%
6.5%
South Carolina
1,055,785
1,063,445
1,069,569
1,078,094
1,084,529
1,089,577
+/- m/m
5,226
7,660
6,124
8,525
6,435
5,048
% y/y
7.6%
7.5%
7.4%
7.9%
7.6%
7.5%
Tennessee
1,692,395
1,704,398
1,710,125
1,718,539
1,726,603
1,734,108
+/- m/m
6,737
12,003
5,727
8,414
8,064
7,505
% y/y
6.0%
6.1%
6.1%
6.0%
5.9%
5.8%
Texas
5,466,045
5,653,169
+/- m/m
N/A
N/A
N/A
N/A
N/A
N/A
% y/y
8.6%
10.6%
Virginia
1,572,923
1,582,973
1,589,722
1,598,875
1,608,840
1,619,311
+/- m/m
11,829
10,050
6,749
9,153
9,965
10,471
% y/y
11.3%
11.0%
10.0%
9.6%
10.1%
9.8%
Washington
1,884,734
1,898,983
1,904,127
1,913,230
1,927,690
1,959,278
+/- m/m
8,867
14,249
5,144
9,103
14,460
31,588
% y/y
#DIV/0!
#DIV/0!
5.8%
5.9%
6.0%
7.2%
West Virginia
519,992
524,042
524,922
527,226
530,494
533,194
+/- m/m
2,871
4,050
880
2,304
3,268
2,700
% y/y
6.5%
6.8%
6.4%
5.9%
5.9%
5.7%
Wisconsin
1,161,202
1,166,208
1,172,719
1,179,204
1,184,899
1,190,673
+/- m/m
5,263
5,006
6,511
6,485
5,695
5,774
% y/y
7.5%
7.2%
7.1%
7.1%
6.9%
6.6%
Note: In Table 1 above and the state tables below, “+/- m/m” refers to the enrollment change from the previous month. “% y/y” refers to the percentage change in enrollment from the same month in the previous year.
Below, we provide a state-specific analysis of recent enrollment trends in the states where HMA tracks data.
It is important to note the limitations of the data presented. First, not all states report the data at the same time during the month. Some of these figures reflect beginning-of-the-month totals, while others reflect an end-of-the-month snapshot. Second, in some cases the data is comprehensive in that it covers all state-sponsored health programs for which the state offers managed care; in other cases, the data reflects only a subset of the broader Medicaid managed care population. This is the key limiting factor in comparing the data described below and figures reported by publicly traded Medicaid MCOs. Consequently, the data we review in Table 1 and throughout the In Focus section should be viewed as a sampling of enrollment trends across these states rather than a comprehensive comparison, which cannot be developed based on publicly available monthly enrollment data.
State-Specific Analysis
Arizona
Medicaid Expansion Status: Expanded January 1, 2014
Enrollment in Arizona’s two Medicaid managed care programs grew to 2.1 million in December 2022, up 7.1 percent from December 2021.
Jul-22
Aug-22
Sep-22
Oct-22
Nov-22
Dec-22
Acute Care
2,002,584
2,012,802
2,028,335
2,039,880
2,049,311
2,060,376
ALTCS
66,464
66,558
66,766
66,920
67,133
67,290
Total Arizona
2,069,048
2,079,360
2,095,101
2,106,800
2,116,444
2,127,666
+/- m/m
8,527
10,312
15,741
11,699
9,644
11,222
% y/y
7.6%
7.5%
7.4%
7.2%
7.1%
California
Medicaid Expansion Status: Expanded January 1, 2014
Medi-Cal managed care enrollment was up 9.5 percent year-over-year to 13.2 million, as of December 2022.
Jul-22
Aug-22
Sep-22
Oct-22
Nov-22
Dec-22
Two-Plan Counties
8,356,137
8,409,817
8,446,514
8,481,885
8,548,096
8,588,418
Imperial/San Benito
100,384
101,117
101,633
102,064
102,881
103,437
Regional Model
364,066
366,437
368,624
370,361
373,402
375,473
GMC Counties
1,435,250
1,445,532
1,452,127
1,458,149
1,470,122
1,391,421
COHS Counties
2,561,831
2,578,747
2,593,003
2,608,731
2,625,795
2,634,112
Duals Demonstration
111,832
111,674
111,526
111,426
111,697
111,537
Total California
12,929,500
13,013,324
13,073,427
13,132,616
13,231,993
13,204,398
+/- m/m
215,506
83,824
60,103
59,189
99,377
(27,595)
% y/y
9.8%
9.9%
9.9%
9.9%
10.2%
9.5%
District of Columbia
Medicaid Expansion Status: Expanded January 1, 2014
Medicaid managed care enrollment in the District of Columbia was up 6.4 percent to almost 251,000 in November 2022.
Jul-22
Aug-22
Sep-22
Oct-22
Nov-22
Total District of Columbia
246,957
247,704
248,577
249,617
250,676
+/- m/m
3,223
747
873
1,040
1,059
% y/y
6.7%
6.7%
6.5%
6.5%
6.4%
Florida
Medicaid Expansion Status: Not Expanded
Florida’s statewide Medicaid managed care program had seen an 11 percent rise in total covered lives over the last year to nearly 4.6 million beneficiaries as of December 2022. (Note that the managed LTC enrollment figures listed below are a subset of the Managed Medical Assistance (MMA) enrollments and are included in the MMA number; they are not separately added to the total to avoid double counting).
Jul-22
Aug-22
Sep-22
Oct-22
Nov-22
Dec-22
MMA
3,908,539
3,948,929
3,978,098
4,010,534
4,041,816
4,080,381
LTC (Subset of MMA)
124,107
124,691
125,397
126,144
126,720
126,621
SMMC Specialty Plan
332,179
338,057
342,325
346,516
350,058
355,638
FL Healthy Kids
145,247
145,247
145,247
145,247
145,247
145,247
Total Florida
4,385,965
4,432,233
4,465,670
4,502,297
4,537,121
4,581,266
+/- m/m
41,441
46,268
33,437
36,627
34,824
44,145
% y/y
10.9%
10.9%
10.7%
10.7%
10.7%
11.0%
Georgia
Medicaid Expansion Status: Not Expanded
As of December 2022, Georgia’s Medicaid managed care program covered more than 2 million members, up 8.3 percent from the previous year.
Jul-22
Aug-22
Sep-22
Oct-22
Nov-22
Dec-22
Total Georgia
1,975,277
1,988,727
2,016,462
2,027,275
2,035,673
+/- m/m
13,117
13,450
10,813
8,398
% y/y
9.8%
9.5%
9.0%
8.7%
8.3%
Illinois
Medicaid Expansion Status: Expanded January 1, 2014
Illinois enrollment across the state’s managed care programs was up 5.5 percent to 3 million as of December 2022.
Jul-22
Aug-22
Sep-22
Oct-22
Nov-22
Dec-22
HealthChoice
2,800,420
2,793,124
2,809,689
2,839,342
2,874,700
2,909,303
Duals Demonstration
89,912
90,905
90,543
90,242
90,307
91,414
Total Illinois
2,890,332
2,884,029
2,900,232
2,929,584
2,965,007
3,000,717
+/- m/m
(8,672)
(6,303)
16,203
29,352
35,423
35,710
% y/y
5.1%
4.5%
4.1%
4.4%
5.1%
5.5%
Indiana
Medicaid Expansion Status: Expanded in 2015 through HIP 2.0
As of December 2022, enrollment in Indiana’s managed care programs—Hoosier Healthwise, Hoosier Care Connect, and Healthy Indiana Program (HIP)—was more than 1.8 million, up 10.3 percent from the previous year.
Jul-22
Aug-22
Sep-22
Oct-22
Nov-22
Dec-22
Hoosier Healthwise
845,910
852,904
857,952
863,973
869,613
876,606
Hoosier Care Connect
102,805
102,819
102,537
102,253
102,200
102,150
HIP
794,047
805,969
808,911
815,238
825,638
834,288
Indiana Total
1,742,762
1,761,692
1,769,400
1,781,464
1,797,451
1,813,044
+/- m/m
6,906
18,930
7,708
12,064
15,987
15,593
% y/y
11.6%
11.3%
11.0%
10.5%
10.2%
10.3%
Iowa
Medicaid Expansion Status: Expanded January 1, 2014
Iowa launched its statewide Medicaid managed care program in April of 2016. Enrollment across all populations was nearly 814,500, as of December 2022. Enrollment was up 6.1 percent from the previous year.
Jul-22
Aug-22
Sep-22
Oct-22
Nov-22
Dec-22
Traditional Medicaid
507,266
510,618
516,556
520,234
521,118
Iowa Wellness Plan
237,910
239,261
242,555
244,724
246,385
hawk-i
50,358
49,869
48,185
47,523
46,987
Total Iowa
795,534
799,748
807,296
812,481
814,490
+/- m/m
2,642
4,214
7,548
2,009
% y/y
5.9%
5.8%
6.4%
6.0%
6.1%
Kansas
Medicaid Expansion Status: Not Expanded
Kansas Medicaid managed care enrollment was nearly 501,000 as of December 2022, up 6.3 percent from the previous year.
Jul-22
Aug-22
Sep-22
Oct-22
Nov-22
Dec-22
Total Kansas
489,309
490,911
492,640
497,257
499,143
500,814
+/- m/m
2,691
1,602
1,729
4,617
1,886
1,671
% y/y
8.3%
6.3%
Kentucky
Medicaid Expansion Status: Expanded January 1, 2014
As of December 2022, Kentucky covered more than 1.5 million beneficiaries in risk-based managed care. Total enrollment was up 6.1 percent from the prior year.
Jul-22
Aug-22
Sep-22
Oct-22
Nov-22
Dec-22
Total Kentucky
1,494,068
1,487,387
1,509,274
1,518,906
1,528,484
1,534,657
+/- m/m
6,069
(6,681)
21,887
9,632
9,578
6,173
% y/y
5.5%
5.3%
5.6%
5.8%
6.7%
6.1%
Louisiana
Medicaid Expansion Status: Expanded July 1, 2016
Medicaid managed care enrollment in Louisiana was more than 1.86 million as of December 2022, up 5.8 percent from the previous year.
Jul-22
Aug-22
Sep-22
Oct-22
Nov-22
Dec-22
Total Louisiana
1,821,644
1,828,015
1,833,457
1,841,693
1,858,092
1,860,170
+/- m/m
7,213
6,371
5,442
8,236
16,399
2,078
% y/y
4.6%
4.5%
4.4%
4.7%
5.2%
5.8%
Maryland
Medicaid Expansion Status: Expanded January 1, 2014
Maryland’s Medicaid managed care program covered more than 1.5 million lives as of December 2022.
Jul-22
Aug-22
Sep-22
Oct-22
Nov-22
Dec-22
Total Maryland
1,496,677
1,502,271
1,508,469
1,514,381
1,521,171
1,529,308
+/- m/m
8,205
5,594
6,198
5,912
6,790
8,137
% y/y
6.5%
6.2%
6.1%
5.8%
5.8%
5.7%
Michigan
Medicaid Expansion Status: Expanded April 1, 2014
As of December 2022, Michigan’s Medicaid managed care was up 4.3 percent to 2.3 million.
Jul-22
Aug-22
Sep-22
Oct-22
Nov-22
Dec-22
Medicaid
2,239,937
2,251,810
2,256,800
2,265,219
2,274,763
2,279,473
MI Health Link (Duals)
40,306
42,622
43,113
44,694
45,188
44,573
Total Michigan
2,280,243
2,294,432
2,299,913
2,309,913
2,319,951
2,324,046
+/- m/m
2,923
14,189
5,481
10,000
10,038
4,095
% y/y
3.8%
3.6%
3.5%
3.7%
4.5%
4.3%
Minnesota
Medicaid Expansion Status: Expanded January 1, 2014
As of December 2022, enrollment across Minnesota’s multiple managed Medicaid programs was nearly 1.3 million, up 7.5 percent from the prior year.
Jul-22
Aug-22
Sep-22
Oct-22
Nov-22
Dec-22
Parents/Kids
748,197
748,513
758,100
763,044
767,798
770,918
Expansion Adults
272,666
273,387
278,421
281,284
284,073
288,680
Senior Care Plus
24,190
24,252
25,344
25,914
26,415
26,740
Senior Health Options
43,429
43,686
43,920
44,162
44,248
44,324
Special Needs BasicCare
64,656
64,484
65,562
65,763
65,987
66,171
Moving Home Minnesota
11
11
10
10
9
11
Minnesota Care
107,963
107,740
107,597
106,713
105,328
102,350
Total Minnesota
1,261,112
1,262,073
1,278,954
1,286,890
1,293,858
1,299,194
+/- m/m
1,893
961
16,881
7,936
6,968
5,336
% y/y
7.3%
6.7%
7.4%
7.5%
7.5%
7.5%
Mississippi
Medicaid Expansion Status: Not Expanded
MississippiCAN, the state’s Medicaid managed care program, had membership down 3.9 percent to nearly 397,000 as of December 2022.
Jul-22
Aug-22
Sep-22
Oct-22
Nov-22
Dec-22
Total Mississippi
367,137
363,387
364,612
355,694
367,902
396,880
+/- m/m
(452)
(3,750)
1,225
(8,918)
12,208
28,978
% y/y
-22.7%
-19.9%
-17.4%
-17.3%
-12.5%
-3.9%
Missouri
Medicaid Expansion Status: Expansion Enrollment began in October 2021
Missouri managed care enrollment in the Medicaid and CHIP programs was nearly 1.2 million in December 2022.
Jul-22
Aug-22
Sep-22
Oct-22
Nov-22
Dec-22
Total Medicaid
758,928
757,312
769,419
775,076
782,863
787,611
Total CHIP
28,949
28,937
29,026
29,121
29,231
29,402
Total AEG
199,963
228,361
250,131
262,612
272,574
287,692
Total SHK
50,399
50,607
51,131
51,564
51,921
52,300
Total Missouri
1,038,239
1,065,217
1,099,707
1,118,373
1,136,589
1,157,005
+/- m/m
26,520
26,978
34,490
18,666
18,216
20,416
% y/y
27.0%
29.1%
32.6%
31.7%
31.8%
29.0%
Nebraska
Medicaid Expansion Status: Expanded October 1, 2020
As of December 2022, Nebraska’s Medicaid managed care program enrolled 378,000 members, up 10.6 percent from the previous year.
Jul-22
Aug-22
Sep-22
Oct-22
Nov-22
Dec-22
Total Nebraska
363,328
366,202
369,770
372,613
374,857
378,237
+/- m/m
2,740
2,874
3,568
2,843
2,244
3,380
% y/y
12.4%
11.9%
11.7%
11.2%
10.8%
10.6%
Nevada
Medicaid Expansion Status: Expanded January 1, 2014
Nevada’s Medicaid managed care enrollment was up 5.7 percent to nearly 693,000 as of December 2022.
Jul-22
Aug-22
Sep-22
Oct-22
Nov-22
Dec-22
Total Nevada
687,362
689,139
697,752
675,465
685,736
692,890
+/- m/m
9,464
1,777
8,613
(22,287)
10,271
7,154
% y/y
9.3%
9.0%
9.3%
4.2%
5.2%
5.7%
New Jersey
Medicaid Expansion Status: Expanded January 1, 2014
As of December 2022, New Jersey Medicaid managed care enrollment was up 7 percent to nearly 2.2 million.
Jul-22
Aug-22
Sep-22
Oct-22
Nov-22
Dec-22
Total New Jersey
2,100,947
2,113,930
2,125,181
2,130,868
2,144,514
2,158,966
+/- m/m
10,897
12,983
11,251
5,687
13,646
14,452
% y/y
7.4%
7.4%
7.2%
7.0%
7.1%
7.0%
New Mexico
Medicaid Expansion Status: Expanded January 1, 2014
As of December 2022, New Mexico’s Centennial Care program covered nearly 816,000 members, up 2.3 percent from the previous year.
Jul-22
Aug-22
Sep-22
Oct-22
Nov-22
Dec-22
Total New Mexico
809,991
811,732
812,995
813,630
814,466
815,798
+/- m/m
2,491
1,741
1,263
635
836
1,332
% y/y
4.2%
3.7%
3.4%
3.0%
2.6%
2.3%
New York
Medicaid Expansion Status: Expanded January 1, 2014
New York’s Medicaid managed care programs collectively covered nearly 6 million beneficiaries as of December 2022, a 4.6 percent increase from the previous year. The Medicaid Advantage program ended in December 2021.
Jul-22
Aug-22
Sep-22
Oct-22
Nov-22
Dec-22
Mainstream MCOs
5,399,089
5,395,489
5,418,915
5,446,409
5,467,467
5,494,358
Managed LTC
255,999
256,538
258,236
257,360
260,087
264,965
Medicaid Advantage
0
0
0
0
0
0
Medicaid Advantage Plus
34,357
34,355
34,689
34,764
34,717
35,061
HARP
164,514
165,067
165,024
166,063
165,340
165,713
FIDA-IDD (Duals)
1,656
1,659
1,655
1,668
1,677
1,685
Total New York
5,855,615
5,853,108
5,878,519
5,906,264
5,929,288
5,961,782
+/- m/m
39,970
(2,507)
25,411
27,745
23,024
32,494
% y/y
4.5%
4.3%
4.2%
4.3%
4.5%
4.6%
North Carolina
Medicaid Expansion Status: Not Expanded
As of December 2022, enrollment in North Carolina’s Medicaid managed care program was 1.8 million, up 9.5 percent from the prior year. North Carolina implemented Medicaid managed care on July 1, 2021.
Jul-22
Aug-22
Sep-22
Oct-22
Nov-22
Dec-22
Total North Carolina
1,738,545
1,746,948
1,757,503
1,768,974
1,778,199
1,837,423
+/- m/m
9,047
8,403
10,555
11,471
9,225
59,224
% y/y
8.0%
6.8%
6.7%
6.6%
6.6%
9.5%
Ohio
Medicaid Expansion Status: Expanded January 1, 2014
As of December 2022, enrollment across all four Ohio Medicaid managed care programs was nearly 3 million, up 0.9 percent from the prior year.
Jul-22
Aug-22
Sep-22
Oct-22
Nov-22
Dec-22
CFC Program
1,800,781
1,800,038
1,798,135
1,796,327
1,798,873
1,804,860
ABD/Duals
348,071
348,176
347,461
347,371
347,473
347,839
Group 8 (Expansion)
815,879
815,402
815,326
814,968
815,637
821,064
Total Ohio
2,964,731
2,963,616
2,960,922
2,958,666
2,961,983
2,973,763
+/- m/m
(1,340)
(1,115)
(2,694)
(2,256)
3,317
11,780
% y/y
3.4%
2.6%
1.9%
1.4%
1.0%
0.9%
Oregon
Medicaid Expansion Status: Expanded January 1, 2014
As of December 2022, enrollment in the Oregon Coordinated Care Organization (CCO) Medicaid managed care program was more than 1.2 million, up 7.2 percent from the previous year.
Jul-22
Aug-22
Sep-22
Oct-22
Nov-22
Dec-22
Total Oregon
1,193,358
1,202,198
1,206,520
1,211,099
1,221,435
1,228,054
+/- m/m
3,920
8,840
4,322
4,579
10,336
6,619
% y/y
8.3%
8.4%
7.7%
7.6%
7.4%
7.2%
Pennsylvania
Medicaid Expansion Status: Expanded January 1, 2015
As of December 2022, Pennsylvania’s Medicaid managed care enrollment was nearly 3 million, up 6.5 percent in the past year.
Jul-22
Aug-22
Sep-22
Oct-22
Nov-22
Dec-22
Total Pennsylvania
2,895,837
2,909,985
2,920,584
2,937,049
2,950,613
2,966,207
+/- m/m
13,973
14,148
10,599
16,465
13,564
15,594
% y/y
7.4%
7.3%
6.9%
6.8%
6.6%
6.5%
South Carolina
Medicaid Expansion Status: Not Expanded
South Carolina’s Medicaid managed care programs collectively enrolled nearly 1.1 million members as of December 2022, which represents an increase of 7.5 percent in the past year.
Jul-22
Aug-22
Sep-22
Oct-22
Nov-22
Dec-22
Total Medicaid
1,041,909
1,049,706
1,056,026
1,064,548
1,071,016
1,076,146
Total Duals Demo
13,876
13,739
13,543
13,546
13,513
13,431
Total South Carolina
1,055,785
1,063,445
1,069,569
1,078,094
1,084,529
1,089,577
+/- m/m
5,226
7,660
6,124
8,525
6,435
5,048
% y/y
7.6%
7.5%
7.4%
7.9%
7.6%
7.5%
Tennessee
Medicaid Expansion Status: Not Expanded
As of December 2022, TennCare managed care enrollment totaled 1.7 million, up 5.8 percent from the prior year.
Jul-22
Aug-22
Sep-22
Oct-22
Nov-22
Dec-22
Total Tennessee
1,692,395
1,704,398
1,710,125
1,718,539
1,726,603
1,734,108
+/- m/m
6,737
12,003
5,727
8,414
8,064
7,505
% y/y
6.0%
6.1%
6.1%
6.0%
5.9%
5.8%
Texas
Medicaid Expansion Status: Not Expanded
Texas’ state fiscal year begins in September and program-specific enrollment is only reported at the end of each state fiscal quarter. As of November 2022, Texas Medicaid managed care enrollment was nearly 5.7 million across the state’s six managed care programs, up 10.6 percent from the previous year.
Jul-22
Aug-22
Sep-22
Oct-22
Nov-22
Dec-22
STAR
4,559,293
4,748,820
STAR+PLUS
559,746
568,456
STAR HEALTH
45,760
46,228
Duals Demo
34,336
33,673
CHIP
97,153
85,773
STAR KIDS
169,757
170,219
Total Texas
5,466,045
5,653,169
+/- m/m
% y/y
8.6%
10.6%
Virginia
Medicaid Expansion Status: January 1, 2019
Virginia Medicaid managed care enrollment was up 9.8 percent in December 2022 to 1.6 million members.
Jul-22
Aug-22
Sep-22
Oct-22
Nov-22
Dec-22
Total Virginia
1,572,923
1,582,973
1,589,722
1,598,875
1,608,840
1,619,311
+/- m/m
11,829
10,050
6,749
9,153
9,965
10,471
% y/y
11.3%
11.0%
10.0%
9.6%
10.1%
9.8%
Washington
Medicaid Expansion Status: Expanded January 1, 2014
Washington’s Medicaid managed care enrollment increased 7.2 percent to nearly 2 million as of December 2022, compared to the previous year.
Jul-22
Aug-22
Sep-22
Oct-22
Nov-22
Dec-22
Total Washington
1,884,734
1,898,983
1,904,127
1,913,230
1,927,690
1,959,278
+/- m/m
8,867
14,249
5,144
9,103
14,460
31,588
% y/y
#DIV/0!
#DIV/0!
5.8%
5.9%
6.0%
7.2%
West Virginia
Medicaid Expansion Status: Expanded January 1, 2014
As of December 2022, West Virginia’s Medicaid managed care program covered 533,000 members, up 5.7 percent year-over-year.
Jul-22
Aug-22
Sep-22
Oct-22
Nov-22
Dec-22
Total West Virginia
519,992
524,042
524,922
527,226
530,494
533,194
+/- m/m
2,871
4,050
880
2,304
3,268
2,700
% y/y
6.5%
6.8%
6.4%
5.9%
5.9%
5.7%
Wisconsin
Medicaid Expansion Status: Not Expanded
Across Wisconsin’s three Medicaid managed care programs, December 2022 enrollment totaled nearly 1.2 million, up 6.6 percent from the year before.
Jul-22
Aug-22
Sep-22
Oct-22
Nov-22
Dec-22
BadgerCare+
1,042,456
1,047,217
1,053,361
1,059,587
1,065,182
1,070,788
SSI
61,841
61,916
62,065
62,129
62,165
62,293
LTC
56,905
57,075
57,293
57,488
57,552
57,592
Total Wisconsin
1,161,202
1,166,208
1,172,719
1,179,204
1,184,899
1,190,673
+/- m/m
5,263
5,006
6,511
6,485
5,695
5,774
% y/y
7.5%
7.2%
7.1%
7.1%
6.9%
6.6%
More Information Available from HMA Information Services
More detailed information on the Medicaid managed care landscape is available from HMA Information Services (HMAIS), which collects Medicaid enrollment data, health plan financials, and the latest on expansions, waivers, duals, ABD populations, long-term care, accountable care organizations, and patient-centered medical homes. HMAIS also includes a public documents library with copies of Medicaid RFPs, responses, model contracts, and scoring sheets.
HMAIS enhances this publicly available information with an overview of the structure of Medicaid in each state, as well as proprietary Medicaid Managed Care RFP calendars.
For additional information on how to subscribe to HMA Information Services, contact Carl Mercurio at 212-575-5929.
[1] Arizona, California, District of Columbia, Florida, Georgia, Illinois, Indiana, Iowa, Kansas, Kentucky, Louisiana, Maryland, Michigan, Minnesota, Mississippi, Missouri, Nebraska, Nevada, New Jersey, New Mexico, New York, North Carolina, Ohio, Oregon, Pennsylvania, South Carolina, Tennessee, Texas, Virginia, Washington, West Virginia, Wisconsin.
This week our In Focus section reviews the Centers for Medicare and Medicaid Services’ (CMS) announcement that the agency will explore three new prescription drug payment models in the Medicare and Medicaid programs:
Medicare High-Value Drug List Model
Cell and Gene Therapy (CGT) Access Model
Accelerating Clinical Evidence Model
The announcement – and accompanying report – responds to President Biden’s October 2022 Executive Order directing CMS’ Center for Medicare and Medicaid Innovation (the Innovation Center) to identify models that could lower cost sharing for commonly used drugs and include value-based payment for drugs.
Notably, the Innovation Center offered varying levels of specificity about the models, leaving unanswered many questions about the structures and timelines for the potential models. The Innovation Center will need to conduct more robust analysis to determine the design specifications for each model, stakeholder interest, and practical and political feasibility for each. In addition, each model will need to have its own application or rulemaking process to identify participants and other key model parameters. While this makes it difficult for the Innovation Center to specify timelines, it provides stakeholders some flexibility to analyze and develop recommendations for the potential models over the next several months.
HMA’s experts are also closely tracking CMS’ work on additional areas identified for the agency to research. For example, CMS could consider other regulatory pathways, partnerships, or campaigns to promote the following changes:
Opportunities to encourage price transparency for prescription drugs
Options to improve biosimilar adoption
Medicare fee-for-service options to support CGT access and affordability
The drug payment models build on other federal and state-level efforts to address prescription drug costs and total cost of care initiatives. For example, CMS’ drug payment model announcement comes just a week after the agency released its implementation approach for the drug payment policies approved as part of the inflation Reduction Act of 2022 (IRA) (P.L. 117-169). CMS is balancing the extensive implementation needs for the IRA while also acknowledging the new law may not directly address other value-based considerations impacting cost and access for certain prescription medications.
Below are some of the highlights of the Innovation Center’s drug payment models.
Medicare High Value Drug List Model
The Medicare High Value Drug List model would provide standardized approach to cost sharing for specified Part D medications. CMS suggests a standardized list with consistent cost-sharing to allow providers to easily identify and prescribe appropriate medications. Part D Sponsors could offer a Medicare-defined standard set of approximately 150 high-value generic drugs with a maximum co-payment of $2 for a month’s supply. Under this model, generic drugs included in the standardized list would not be subject to step therapy, prior authorization, quantity limits, or pharmacy network restrictions.
According to the report, CMS could explore leveraging existing systems, which would allow for a streamlined implementation. CMS also plans to seek input from beneficiaries, Part D Sponsors, manufacturers, and providers, but the agency did not provide a more specific timeline for announcing the Model specifications and start date.
Cell and Gene Therapy (CGT) Access
The Cell and Gene Therapy (CGT) Access model would be a voluntary opportunity for states and manufacturers. The model builds on existing state Medicaid initiatives to develop outcomes-based agreements (OBAs) with certain manufacturers of high-cost and breakthrough medications. CMS suggests the multistate test could inform a more permanent framework for evaluating, financing, and delivering CGTs on a broader scale. This model may also help address complexities with the federal drug rebate requirements in states that wish to pursue value-based contracting arrangements. Under this model a state Medicaid agency could choose to adopt the CMS structure for multi-state OBAs with participating manufacturers. CMS would be responsible for implementing, monitoring, reconciling, and evaluating financial and clinical outcomes. Initially the model would focus on CGTs for illnesses like sickle cell disease and cancer. This approach could remove some of the barriers that have slowed state uptake of OBAs.
CMS plans to begin model development in 2023, announce the model sometime in 2024-25, and test it as early as 2026.
Accelerating Clinical Evidence Model
The Innovation Center is considering mandatory participation for Medicare Part B providers in the Accelerating Clinical Evidence Model. Under this potential model, the agency would adjust Medicare Part B payment amounts for Accelerated Approval Program (AAP) drugs to determine if adjustments incentivize manufacturers to timely complete trials, which in turn may facilitate earlier availability of clinical evidence.
The Innovation Center identified some challenging aspects for this model and stated the agency will need to consult with the U.S. Food and Drug Administration (FDA) in 2023 to consider approaches for this model. Statements from agency officials about the model also indicate the need for consultation with the Medicare Payment Advisory Commission (MedPAC) and other stakeholders, including through an Advance Notice of Proposed Rulemaking.
If the Innovation Center determines this model is feasible, the agency will provide more details about a targeted launch. The Innovation Center has previously attempted to implement mandatory Part B drug payment models but never implemented them due to legal challenges and stakeholder opposition.
HMA and HMA companies will continue to analyze these potential models and initiatives developing in parallel with the Innovation Center’s work. We have the depth and breadth of expertise to assist with tailored analysis, to model policy impacts of the potential models, and to support the drafting of feedback to CMS as it considers these options.
If you have questions about the Innovation Center’s proposed models and how it will affect manufacturers, Medicare providers, Medicaid programs and patients, contact Amy Bassano ([email protected]), Kevin Kirby ([email protected]) or Andrea Maresca ([email protected]).
Leaders at the Centers for Medicare and Medicaid Services (CMS) announced in the New England Journal of Medicine this month a new initiative called the “Universal Foundation,” which seeks to align quality measures across the more than 20 CMS quality initiatives. The implications for the broader healthcare system are immense.
At Health Management Associates upcoming quality conference March 6 in Chicago, Dr. Lee Fleisher, one of the authors of the Universal Foundation initiative and, Chief Medical Officer and Director, CMS’ Center for Clinical Standards and Quality, will deliver the keynote address “A Vision for Healthcare Quality: How Policy Can Drive Improved Outcomes.”
Attendees will hear from industry leaders and policy makers about evolving healthcare quality initiatives and participate in substantive workshops where they will learn about and discuss solutions that are using quality frameworks to create a more equitable health system. In addition to Dr. Fleisher, featured speakers will include executives from American College of Surgeons, ANCOR, CareJourney, CareOregon, Commonwealth Care Alliance, Council on Quality and Leadership, Denver Health, Institute on Public Policy for People with Disabilities, Intermountain Health, NCQA, Reema Health, Kaiser Permanente, Social Interventions Research and Evaluation Network, UnitedHealth Group, United Hospital Fund, 3M, and many other organizations.
The Universal Foundation seeks to align quality measures to “focus providers’ attention on measures that are meaningful for the health of broad segments of the population; reduce provider burden by streamlining and aligning measures; advance equity with the use of measures that will help CMS recognize and track disparities in care among and within populations; aid the transition from manual reporting of quality measures to seamless, automatic digital reporting; and permit comparisons among various quality and value-based care programs, to help the agency better understand what drives quality improvement and what does not.”
CMS has established a cross-center working group focused on coordination of these processes and on development and implementation of aligned measures to support a consistent approach. As part of this announcement, the group published a list of Preliminary Adult and Pediatric Universal Foundation Measures. This new quality program will affect clinicians, healthcare settings such as hospitals or skilled nursing facilities, health insurers, and value-based entities such as accountable care organizations.
HMA can help organizations improve their quality efforts in line with the new CMS Universal Foundation initiative. HMA’s more than 500 consultants include past roles as senior officials in Medicaid and Medicare, directors of large nonprofit and social services organizations, top-level advisors, C-level executives at hospitals, health systems and health plans, and senior-level physicians. Our depth of industry-leading policy expertise and clinical experience provides comprehensive solutions that make healthcare and human services work better for people.
To learn more about HMA and Quality, follow #HMAtalksQuality on Twitter and LinkedIn. View the full agenda and register for HMA’s first annual quality conference on March 6 in Chicago. Registration closes on February 21, 2023.
This week, our In Focus section reviews the California amendment to the Section 1115 Waiver Demonstration titled, “California Advancing and Innovating Medi-Cal (CalAIM),” approved by the Centers for Medicare & Medicaid Services (CMS) on January 26, 2023. The amendment will provide targeted Medi-Cal services to individuals in state prisons, county jails, and youth correctional facilities for up to 90 days prior to release. This marks the first time in the nation that Medicaid will pay for a limited set of health care services provided to justice-involved individuals before they are released. The approval is effective through the end of the CalAIM demonstration, ending December 31, 2026, unless extended or amended.
The justice-involved initiative is part of the broader CalAIM demonstration, approved December 29, 2021. For more information on CalAIM, please see HMA’s write up from March 2021.
Background
California was one of the first of 11 states – Arizona, California, Kentucky, Massachusetts, Montana, New Jersey, New York, Oregon, Utah, Vermont, and Washington – to propose a demonstration to provide Medicaid-covered healthcare services to justice-involved populations before release. CMS plans to issue guidance on the Reentry Demonstration Opportunity to support community reentry and improvement in care transitions for individuals up to 30 days prior to their scheduled release.
California’s reentry demonstration initiative aims to address the needs of incarcerated beneficiaries as they near the end of their incarceration and reenter the community by improving connections and coordination between the correctional, health care, and social service systems. Currently, Medi-Cal services are only available after release from incarceration.
In California, more than one million adults and youth enter or are released from prisons and jails annually, with at least 80 percent eligible for Medi-Cal. The justice-involved individuals are disproportionately people of color, compared to the state population. Formerly incarcerated individuals are also more likely to experience poor health outcomes and face disproportionately higher rates of physical and behavioral health diagnoses. These individuals are at higher risk for injury and death as a result of violence, overdose, and suicide compared to people who have never been incarcerated.
Demonstration
California will be required to submit for CMS approval a Reentry Initiative Implementation Plan and Reinvestment Plan documenting how the state will operationalize coverage and provision of pre-release services and how existing state funding for carceral health services will continue to support access to necessary care and achievement of positive health outcomes for the justice-involved population.
The goals of the demonstration are to:
“Increase coverage, continuity of coverage, and appropriate service uptake through assessment of eligibility and availability of coverage for benefits in carceral settings just prior to release;
Improve access to services prior to release and improve transitions and continuity of care into the community upon release;
Improve coordination and communication between correctional systems, Medicaid and CHIP systems, managed care plans, and community-based providers;
Increase additional investments in health care and related services, aimed at improving the quality of care for beneficiaries in carceral settings and in the community to maximize successful reentry post-release;
Improve connections between carceral settings and community services upon release to address physical health, behavioral health, and health-related social needs;
Provide intervention for certain behavioral health conditions and using stabilizing medications like long-acting injectable anti-psychotics and medications for addiction treatment for SUDs, with the goal of reducing decompensation, suicide-related deaths, overdoses, and overdose-related deaths in the near-term post-release; and
Reduce post-release acute care utilizations such as emergency department (ED) visits and inpatient hospitalizations and all-cause deaths among recently incarcerated Medicaid beneficiaries and individuals otherwise eligible for CHIP if not for their incarceration status through robust pre-release identification, stabilization, and management of certain serious physical and behavioral health conditions that may respond to ambulatory care and treatment (e.g., diabetes, heart failure, hypertension, schizophrenia, SUDs) as well as increased receipt of preventive and routine physical and behavioral health care.”
Eligible individuals under the demonstration will be assigned a care manager while they are incarcerated, as well as a community-based care manager upon their release. Pre-release services will be anchored in comprehensive care management and include physical and behavioral clinical consultation, lab and radiology, Medication Assisted Treatment (MAT), community health worker services, and medications and durable medical equipment. These services will be available for up to 90 days immediately prior to the individual’s expected release date. California expects that it will be able to reduce decompensation, suicide-related death, overdose, and overdose-related deaths in the near-term post-release.
As a condition of approval of this demonstration amendment, CMS is also requiring California to make pre-release outreach, along with eligibility and enrollment support, available to all individuals incarcerated in the facilities in which the demonstration is functioning. Effective January 1, 2023, state statute directs all counties implementing Medi-Cal application processes in county jails and youth correctional facilities to “suspend” their status while an individual is in jail or prison, and easily “turn on” when they enter the community so they can access essential health care services upon release.
The demonstration is expected to begin in April 2024. Correctional facilities can choose their launch date within 24 months of the go-live date and will be subject to a readiness review process before they can launch.
Additional Requirements
Under the amendment, CMS approved the state’s Designated State Health Program (DSHP) financing plan. Under this DSHP, California will receive federal matching funds to support the Providing Access and Transforming Health (PATH) program. As a condition of receiving this funding and as part of the approval, CMS requires California to increase and sustain Medicaid fee-for-service provider payment rates and Medicaid managed care payment rates for obstetrics, primary care, and behavioral health services. According to the U.S. Department of Health and Human Services (HHS), “in obstetrics alone, this represents the potential for $60 million to be invested in the health of pregnant and postpartum women by increasing access to providers and therein improving health outcomes for pregnant women.” The rate increase will close the gap between Medicaid and Medicare rates by at least 2 percentage points, should the state’s average Medicaid to Medicare provider rate ratio be below 80 percent in any of these categories.
Under this amendment, CMS is also updating the budget neutrality methodology for two previously approved community supports, short-term post-hospitalization services and recuperative care, that address health-related social needs.
Join us on Monday, March 6, 2023, at the Fairmont Chicago, Millennium Park, for “Healthcare Quality Conference: A Deep Dive on What’s Next for Providers, Payers, and Policymakers,” where Lee Fleisher, MD, chief medical officer and director of CMS’ Center for Clinical Standards and Quality, will deliver the keynote titled A Vision for Healthcare Quality: How Policy Can Drive Improved Outcomes.
HMA’s first annual quality conference will provide organizations the opportunity to “Focus on Quality to Improve Patients’ Lives.” Attendees will hear from industry leaders and policy makers about evolving health care quality initiatives and participate in substantive workshops where they will learn about and discuss solutions that are using quality frameworks to create a more equitable health system.
In addition to Fleisher, featured speakers will executives from ANCOR, CareOregon, Commonwealth Care Alliance, Council on Quality and Leadership, Intermountain Healthcare, NCQA, Reema Health, Kaiser Permanente, United Hospital Fund, and others.
Working sessions will provide expert-led discussions about how quality is driving federal and state policy, behavioral health integration, approaches to improving equity and measuring the social determinants of health, integration of disability support services, stronger Medicaid core measures, strategies for Medicare Star Ratings, value-based payments, and digital measures and measurement tools. Speakers will provide case studies and innovative approaches to ensuring quality efforts result in lasting improvements in health outcomes.
“What’s different about this conference is that participants will engage in working sessions that provide healthcare executives tools and models for directly impacting quality at their organizations,” said Carl Mercurio, Principal and Publisher, HMA Information Services.
View the Full Agenda
Early Bird registration ends January 30. Visit the conference website for complete details or contact Carl Mercurio at 212-575-5929/[email protected]. Group rates and sponsorships are available.
As respiratory syncytial virus (RSV), a seasonal pathogen in young children is challenging the national health care system as part of an unprecedented “tripledemic” with COVID-19 and flu this winter, HMA authors weigh in on potential coverage pathways for new monoclonal antibody (mAb) preventive therapies for RSV and their implications for access.
The Vaccines for Children (VFC) program is a proven vehicle for ensuring comprehensive coverage of immunizations based on recommendations from the Advisory Committee on Immunization Practices (ACIP). An ACIP workgroup is actively discussing potential recommendations for immunization with RSV mAbs.
In the recent Health Affairs Forefront article, “Coverage By Vaccines For Children Program Is Critical For RSV Therapy Access,” HMA authors Helen DuPlessis, MD, FAAP, Diana Rodin, and Matt Wimmer explore the implications of ACIP recommendations, Medicaid coverage pathways, and children’s access to the new therapies.
This week, our In Focus section reviews changes to Medicaid’s COVID-19 Public Health Emergency (PHE) unwinding. People enrolled in the Medicaid program have been continuously enrolled for almost three years, but that situation is about to change. In December 2022, Congress passed and the President signed into law a massive compromise bill to fund the government. It includes an important change to Medicaid’s continuous enrollment policy, which has been in effect since the early days of the COVID-19 PHE in March 2020.
Congress passed the Families First Coronavirus Relief Act (FFCRA) in March 2020. This legislation has allowed states to receive a 6.2 percentage point increase in their federal matching rate for Medicaid. As a condition for receiving the enhanced funding, states have been prohibited from disenrolling individuals who were otherwise determined ineligible for Medicaid. As a result, nearly 20 million more people are now enrolled in the Medicaid program.
The 2023 spending bill severs the link between the COVID-19 PHE declaration, the continuous enrollment requirement, and the higher federal match rate. The new law:
Ends the Medicaid continuous coverage policy on March 31, 2023, even if the PHE declaration remains in effect. States may begin issuing terminations of ineligible individuals as early as February 1, with an effective date of April 1.
Phases down the 6.2 percentage point increase in the federal matching rate rather than ending it abruptly at the end of the PHE as required under the FFCRA. Specifically, the increase will drop to 5 percentage points in April−June 2023, 2.5 percentage points in July−September 2023, and 1.5 percentage points in October−December 2023.
Does not end the PHE or other flexibilities linked to the PHE.
Congress also added new parameters and reporting requirements for states as they resume annual eligibility renewals with coverage cancellation for individuals who no longer qualify. These requirements are in addition to data the Centers for Medicare & Medicaid Services (CMS) previously directed states to report. For example:
States must maintain up-to-date enrollee contact information for individuals who will undergo an eligibility redetermination.
States cannot disenroll individuals based only on returned mail.
Prior to disenrolling an individual, the state must make a “good faith effort” to contact the person using more than one communication mode.
States must submit to CMS “on a timely basis” a report explaining their eligibility redetermination activities.
States must submit data related to individuals whose eligibility information was transferred between Medicaid and the Marketplace, with some exceptions for states that have integrated Medicaid and Marketplace eligibility systems and those that use the Federally Facilitated Marketplace.
Beyond the “Delinking”
The new law includes other important eligibility-related policies that may affect state and stakeholder planning for what is often referred to as the “unwinding” of continuous enrollment. Notably, the state Medicaid and CHIP programs will now be required to provide 12 months of continuous coverage for children. A total of 24 states already have adopted the 12-month continuous eligibility option for all children enrolled in Medicaid. While the new requirement will not take effect until January 1, 2024, additional states could adopt this option as they resume normal eligibility operations.
In addition, the new law makes permanent the option for states to extend Medicaid postpartum coverage to 12 months, up from 60 days. The one-year postpartum coverage option initially was approved in the American Rescue Plan but for a limited period of five years. Making the option permanent provides more certainty for states. Nearly two-thirds of states have already implemented or are planning to implement the 12-month postpartum coverage extension.
What Happens Next?
The definitive end date for the continuous enrollment policy sets in motion certain federal and state actions and the process for unwinding. On January 5, 2023, CMS published its first guidance to states on processes related to the new unwinding date. The agency is developing additional guidance and will use other communication tools to provide states with greater clarity on the new statutory reporting, matching rate, and federal agency expectations and oversight.
State plans: All states must submit unwinding plans to CMS by February 15; however, February 1 is the deadline for states that intend to begin renewals in February. These proposals must provide details regarding unwinding strategies, the timeline for starting enrollee renewals, and the pace of ongoing renewal processes. The specific end date for the continuous enrollment policy is driving more states to review and finalize their initiatives and engage with stakeholders.
Impact on health plans and providers: The unwinding process will create important decision points and considerations for Medicaid health plans and providers that have members and patients whom the unwinding process may affect in the next 12-18 months. The law’s requirements reinforce the imperative for states, Medicaid health plans, providers, and other partners to renew efforts to confirm enrollee contact information. The unwinding all will create new considerations for Medicaid health plans with respect to enrollee support, case mix, and rate setting issues.
State budgets and legislation: Many states will kick off their legislative sessions this month. The unwinding process—especially the phase-out of higher federal funding—has important implications for state budgets. State legislatures also may address the new continuous eligibility requirements for children and the permanent option for 12 months of postpartum coverage. As a result, Medicaid will likely remain a top priority during upcoming legislative sessions.
Federal oversight and enforcement: The law’s enhanced reporting provision is intended to provide safeguards to ensure eligible individuals remain enrolled in Medicaid. The reporting also focuses on data related to identifying and directing individuals likely to be eligible for the Marketplace program. Although CMS must publicly report these data, the agency has offered no specific timeline for posting the information. Notably CMS has oversight tools and may impose financial penalties on states that are noncompliant with the unwinding requirements.
Forthcoming federal guidance will confirm the parameters for state unwinding actions, CMS’s plans for oversight of state work, and how these efforts affect current Medicaid enrollees. Medicaid partners should closely monitor state level actions, including announcement of state unwinding plans and opportunities for collaboration. Earlier blogs describe the strategies and actions HMA is working with states and partners to undertake as they prepare for this significant change in Medicaid eligibility policies.